Tuesday, May 28, 2013

Planck's Constant from an LED


Introduction:

Using LED's and a diffraction grating setup, we may formulate a result for Plank's constant.  In this experiment, we will measure the wavelength produced by approximately monochromatic light sources by passing their light through a diffraction grating.  Similar to the previous experiment, the point of interest, as seen through the diffraction grating will allow us to geometrically solve for the wavelength of the LED.  We know this value is correct since wavelengths will constructively interfere at the point of interest.  From this, our formula for Planck's constant will be used given the wavelengths of several LEDs.  Uncertainty and error calculations will be compared in our measurements.

Steps:


The apparatus from Color and Spectra is used to find LED's wavelength


Setup with LED powered by a voltage source in series with the LED and resistor seen  in the background of this image.

We will also use the previous equation,
where L is the distance to the LED, d is the diffraction grating spacing, and D is the distance from the LED to the point of interest (constructive interference point).

Once each LED's data is tabulated, we use

Red LED trial


Blue LED trail

Green LED trail

Yellow LED trail


White LED trail (for comparison purposes)


The data and uncertain calculations are done below.
Where uncertainties are calculated as


Questions/Conclusion:

As we looked through the spectroscope, we noticed only white was a mixture of color out of all the LEDs. This makes sense since it's an incoherent light source with a mixture of wavelengths.  The colored LEDs are monochromatic.  Therefore, the white LED, as seen through the spectroscope, will produce a band of colors associated with the visible spectrum.
As seen in the table, yellow and green LEDs produced most deviation from uncertainty.
Although the table above shows wavelengths out of order, we observe that voltage increases as we decrease wavelength.  This makes sense since higher frequency ( lower wavelength) light has more energy by E=hf.
The slope of our graph yielded 1*10^-6.
The slope

is associated with our measured values of this experiment. This equates to

We notice the right side of the equation is all known constants where
hc/q = 1.24*10^-6
our result therefore has an error

This is a settling result since we took many measurements in our experiment that added towards uncertainty.

Monday, May 27, 2013

Color and Spectra


Introduction:

This experiment will investigate the spectrum of colors associated with white light and hydrogen tubes.  An incandescent light bulb will simulate our white light source.  White light is a combination of many wavelength and emits the whole range of visible light.  We will observe the maximum and minimum wavelength visible.  The hydrogen gas tube contains many single hydrogen atoms.  We know electrons in hydrogen shells will transition given a high potential.  Here we use 5000 volts across the tube.  Photons of certain wavelengths will be absorbed.  We will investigate which wavelength should theoretically be absorbed and take measurements to confirm using the setup to be described.  A grating will separate the spectrum for us.

Steps:


By similar triangles of the grating and eyeball side-view we obtain a relationship between the apparatus distances and the wavelength of light observed:


Actual setup of the apparatus.


Observed spectrum from incandescent light bulb. We observe violet to be the closest to the  light bulb and red the furthest away.
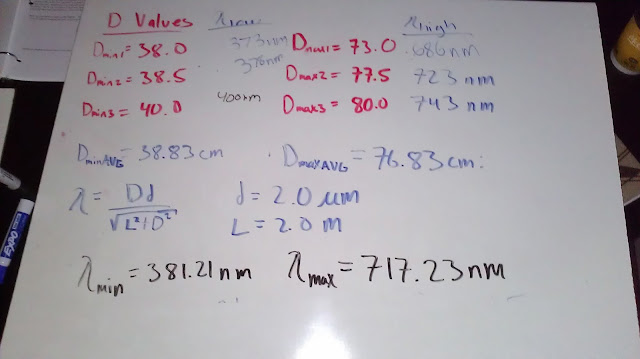
Observed D values averaged then wavelength calculated.
Uncertainty associated with the above measurements. As seen in many figures, calculators were essential to this experiments success.
Given the theoretical values of the visible spectrum ranging from 392-744 nm, we fitted
Linear fit to check agreement with calculated results.

The shortest wavelength we observed in the visible spectrum was 381.21 nm.
The longest wavelength observed was 717.23 nm.


Using a hydrogen gas tube:


Calculations for theoretical values of wavelengths to be observed on hydrogen gas tube. Where R is the Rydberg constant.


A hydrogen gas tube spectrum observation

Measurements and calculations made on successive trials for our hydrogen tube.  Uncertainty is included.
The colors observed in the above figure were only in the red and blue/violet range.

Conclusion:

The error associated with the hydrogen gas tube can calculated as:
These results are pleasingly precise as they were all within uncertainty.

Tuesday, May 21, 2013

Potential Energy Diagrams and Potential Wells

A particle of energy 12 x 10-7 J moves in a region of space in which the potential energy is 10 x 10-7 J between the points -5 cm and 0 cm, zero between the points 0 cm and +5 cm, and 20 x 10-7 J everywhere else.


Question 1: Range of Motion
What will be the range of motion of the particle when subject to this potential energy function?


The particle is between +-5 cm.


Question 2: Turning Points
Clearly state why the particle can not travel more than 5 cm from the origin.

The energy that the particle has is less than the energy at the top of the well.

Question 3: Probability of Detection
Assume we measure the position of the particle at several random times. Is there a higher probability of detecting the particle between -5 cm and 0 cm or between 0 cm and +5 cm?

The particle is most likely to be found between -5cm and 0cm because the particle has less kinetic energy at U_1 it moves slower, thus spending more time there.

Question 4: Range of Motion
What will happen to the range of motion of the particle if its energy is doubled?


The range of motion increases

Question 5: Kinetic Energy
Clearly describe the shape of the graph of the particle's kinetic energy vs. position.

The shape is an concave down parabola.

Question 6: Most Likely Location(s)
Assume we measure the position of the particle at several random times. Where will the particle most likely be detected?

The edges. 


A particle is trapped in a one-dimensional region of space by a potential energy function which is zero between positions zero and L, and equal to U0 at all other positions. This is referred to as a potential well of depth U0
Examine a proton in a potential well of depth 50 MeV and width 10 x 10-15 m.


Question 1: Infinite Well
If the potential well was infinitely deep, determine the ground state energy. Is this also the ground state energy in the finite well?

E_1(infinite well) = (1)^2(h)^2/(8*(mass of proton)*(10*10^-15) = 2.05MeV
E_1(finite well) = 1.8MeV 

The ground state energy of an infinite well is more than the ground state energy of a finite well.

Question 2: First Excited State
If the potential well was infinitely deep, determine the energy of the first excited state (n = 2). Is this also the energy of the first excited state in the finite well?

E_2(infinite) = 4E_1 = 8.20MeV.
E_2(finite) = 6.8 MeV
The energy of the first excited state in the finite well is not the same as the one in the infinite well.

Question 3: "Forbidden" Regions
Since the wavefunction can penetrate into the "forbidden" regions, will the energy of the first excited state in the finite well to be greater than or less than the energy of the first excited state in the infinite well? Why? 

The energy in the first excited state in the finite well is less than the first excited state in the infinite well due to the greater probability of tunneling.

Question 4: More Shallow Well
Will the energy of the n = 3 state increase or decrease if the depth of the potential well is decreased from 50 MeV to 25 MeV? Why? 

The energy of the n=3 state decreases if the potential well is decreased from 50MeV to 25MeV due to less tunneling.

Question 5: Penetration Depth
What will happen to the penetration depth as the mass of the particle is increased?
As the mass of the particle increases the penetration depth decreases 

Relativity of Time and Length

Introduction:

This activity will simulate the effects of length contraction and time dilation as predicted by relativistic equations.

Steps:

Relativity of Time
  
Question 1: Distance traveled by the light pulse

How does the distance traveled by the light pulse on the moving light clock compare to the distance traveled by the light pulse on the stationary light clock?

Answer 1: The distance travelled by the stationary clock is longer by a factor of gamma=1.41


Question 2: Time interval required for light pulse travel, as measured on the earth
Given that the speed of the light pulse is independent of the speed of the light clock, how does the time interval for the light pulse to travel to the top mirror and back on the moving light clock compare to on the stationary light clock?

Answer 2: The time of the stationary clock is longer by (9.4 – 6.67)*10^-6 s = 2.73 *10^-6 s .


Question 3: Time interval required for light pulse travel, as measured on the light clock
Imagine yourself riding on the light clock. In your frame of reference, does the light pulse travel a larger distance when the clock is moving, and hence require a larger time interval to complete a single round trip?

Answer 3: You observe a shorter distance and a longer time interval than the stationary observer.


Question 4: The effect of velocity on time dilation
Will the difference in light pulse travel time between the earth's timers and the light clock's timers increase, decrease, or stay the same as the velocity of the light clock is decreased?

Answer 4: The difference in light pulse travel time will decrease.

Question 5: The time dilation formula
Using the time dilation formula, predict how long it will take for the light pulse to travel back and forth between mirrors, as measured by an earth-bound observer, when the light clock has a Lorentz factor (γ) of 1.2.

Answer 5: (6.67*10^-6)(1.2) = 8.004*10^-6s

Question 6: The time dilation formula, one more time
If the time interval between departure and return of the light pulse is measured to be 7.45 µs by an earth-bound observer, what is the Lorentz factor of the light clock as it moves relative to the earth?

Answer 6:
7.45*10^-6 = (6.67*10^-6) γ
γ = 7.45/6.67
γ = 1.12

Relativity of Length

Question 1: Round-trip time interval, as measured on the light clock
Imagine riding on the left end of the light clock. A pulse of light departs the left end, travels to the right end, reflects, and returns to the left end of the light clock. Does your measurement of this round-trip time interval depend on whether the light clock is moving or stationary relative to the earth?

Answer 1: Yes, the moving light clock will experience a time interval longer than the stationary clock by a Lorentz factor.


Question 2: Round-trip time interval, as measured on the earth
Will the round-trip time interval for the light pulse as measured on the earth be longer, shorter, or the same as the time interval measured on the light clock?

Answer 2: The round-trip time interval measured on the earth is longer by a Lorentz factor.


Question 3: Why does the moving light clock shrink?
You have probably noticed that the length of the moving light clock is smaller than the length of the stationary light clock. Could the round-trip time interval as measured on the earth be equal to the product of the Lorentz factor and the proper time interval if the moving light clock were the same size as the stationary light clock?

Answer 3:  Yes, since there is no length contraction the Lorentz factor is 1.

Question 4: The length contraction formula
A light clock is 1000 m long when measured at rest. How long would earth-bound observer's measure the clock to be if it had a Lorentz factor of 1.3 relative to the earth?

Answer 4: 1000m/1.3 = 769.23m


Questions/Conclusion:

We observed the effects of time dilation and length contraction when approaching speeds close to that of light.  Time seems to move slower and lengths seem to contract in the proper reference frame.  They are all altered by a factor of gamma.